Trends and data: 140+ NEW and powerful marketing statistics for 2022
We’ve compiled an extensive list of recent marketing statistics to help practitioners win in 2022.

The digital content marketing space continues to change rapidly. What’s effective now may not be as potent tomorrow. It’s important that practitioners from all walks of life stay up to date on the latest marketing statistics and trends.
ContentGrip has compiled bite-sized data from various reports to help marketers succeed in 2021. Below, we touch on data that’s relevant to the digital marketing space, which includes but is not necessarily limited to content marketing, video marketing, digital advertising, PR, and social media.
We did not include any data that’s older than three years. Marketers can access the original data sources and reports down at the bottom.
This page will be updated regularly, so feel free to bookmark it.
Digital marketing statistics
- The top five digital marketing priorities in 2022 among enterprise marketers are digital advertising, website user experience, content marketing, email marketing, and organic search. (Conductor, 2022)
- 36% of marketers will increase their omnichannel marketing budgets in 2021. (Criteo, 2021)
- Marketers are prioritizing new customer acquisition over improving marketing ROI. (Criteo, 2021)
- Sales remain the number one KPI among marketers, ranking higher than cost of sales or customer acquisition costs. (Criteo, 2021)
- Greater digitalization of business processes and scaling online presence have become marketers’ top priorities in anticipation of future Covid-19-type situations. (Criteo, 2021)
- 32% of marketers still find it difficult to measure ROI on digital marketing campaigns. (Criteo, 2021)
Digital marketing statistics related to COVID-19
- 38% of marketers saw more website sales and conversions in 2020. (Criteo, 2021)
- One in three marketers say the pandemic has resulted in rapid digital transformation of business processes. (Criteo, 2021)
- Nine in ten marketers share that they have made changes to marketing strategies. (Criteo, 2021)
- 43% of marketers say their budgets will increase for retargeting/paid display and advertising on retail websites/apps in 2021. (Criteo, 2021)

Content marketing statistics
- The global content marketing industry will grow by 16% CAGR or US$417.85 billion from 2020 to 2025. (Technavio, 2022)
- The APAC region is a key growth driver for the global content marketing industry, controlling a 42% market share. (Technavio, 2022)
- China and Japan are poised to record the fastest content marketing industry growth across APAC. (Technavio, 2022)
- 98% of B2B marketers create social media content, newsletters, and blog posts. (Casted, 2022)
- More than half of B2B marketers (61%) publish videos and webinars. They also create whitepapers (47%) and podcasts (32%). (Casted, 2022)
- B2B content marketers are spending 33 hours (83%) of their work week on content creation. (Casted, 2022)
- Here are the average time it takes for B2B marketers to create a piece of content: videos (6.2 hours), webinars (5.7 hours), ebooks / whitepapers (5.0 hours), podcasts (4.8 hours), blog posts (4.7 hours), and social media (3.4 hours). (Casted, 2022)
- B2B marketers focus on creating content related to new customer marketing (95%) and sales (94%), with marketing for current customers (38%) coming in at a distant third. (Casted, 2022)
- 89% of B2B marketers use video and audio content for social media messages, but only 11% include video and audio for blog posts and newsletters. (Casted, 2022)
- Half of B2B marketers (48%) use webinar clips for social media and email channels. (Casted, 2022)
- 70% of marketers are actively investing in content marketing. Roughly 60% of marketers stated that content marketing is ‘very important’ or ‘extremely important’ to their overall strategy. (HubSpot, 2020)
- 44% of marketers say their content marketing budgets will increase in 2021. (Criteo, 2021)
- 79% of B2B marketers share that they have a content marketing strategy. (CMI, 2020)
- 85% of B2B marketers saw promising results on their content marketing campaigns. (CMI, 2020)
- B2B marketers believe that the value the content provides is more important than search rankings. (CMI, 2020)
- The biggest content marketing challenge among B2B marketers is content creation. Additionally, content creation is the biggest activity that they usually outsource, and they’re likely to invest more in 2021. (CMI, 2020)
- 31% of B2B organizations increased their content marketing team sizes in 2020. (CMI, 2020)
- Only 12% of B2B organizations decreased their content marketing team sizes in 2020. (CMI, 2020)
- 49% of B2B marketers outsource content marketing activities. (CMI, 2020)
- The outsourcing challenge for B2B marketers is finding partners with adequate topic expertise. (CMI, 2020)
- The two tools that most B2B marketers use are analytics and social media tools. (CMI, 2020)
- The top two editorial tools that B2B marketers use are SEO and editorial calendar. (CMI, 2020)
- Blog posts remain the number one content type used among B2B marketers, followed by email newsletters. (CMI, 2020)
- Only 32% of B2B organizations have established an online community. (CMI, 2020)
- The top three content distribution channels used among B2B marketers are social media, email, and company blog. (CMI, 2020)
- LinkedIn was the top social media platform among B2B marketers in 2020. (CMI, 2020)
- Website traffic was the top performance metric used among B2B marketers in 2020. (CMI, 2020)
- B2B marketers still find difficulty in using content marketing to support the launch of a new product. (CMI, 2020)
- Organic search is the biggest traffic source for blogs, accounting for 59.22% of traffic among SaaS firms. Additionally, organic search is also the fastest growing channel at 9.01% per month. (Animalz, 2020)
- The median SaaS blog generates 16,969 monthly pageviews. (Animalz, 2020)
- SaaS blogs with more than 1 million yearly pageviews generate 86.52% of their traffic from organic search. (Animalz, 2020)
- SaaS blogs take a median of 9 years to reach 1 million annual pageviews. (Animalz, 2020)
- 80% of SaaS blog readers leave after reading one page. (Animalz, 2020)
- The median time spent by SaaS blog readers is three minutes and 15 seconds. (Animalz, 2020)
- 66.3% of total content marketing budget spend in the US in 2020 went to digital channels, ahead of TV (10.4%) and direct mail (7%). (Borrell, 2020)
- Half of marketers say that their content marketing performance in 2020 was better than the year before. (SEMrush, 2021)
- Marketers reveal that SEO was their most efficient content marketing tactic in 2020. Meanwhile, the most challenging tactic was leveraging the power of user generated content. (SEMrush, 2021)
- The top content marketing goals among marketers are generating quality leads and increasing website traffic. (SEMrush, 2021)
- 61% of marketers are measuring their content marketing ROI. (SEMrush, 2021)
SEO marketing statistics
- 91% of enterprises with high-level of SEO maturity infrastructure saw at least a 5% increase in website performance in 2021. However, only 2% of those with low-level maturity recorded similar progress. (Conductor, 2022)
- 70% of mid-sized and large enterprises increased their organic marketing budget in 2021. (Conductor, 2022)
- 78% of marketers believe organic marketing will positively influence their business goals in 2022. (Conductor, 2022)
- Nearly half of enterprises (46%) with high-level organic marketing maturity outsource at least half of SEO work. (Conductor, 2022)
- The three top players for enterprises to outsource organic marketing work are: technology vendors, consulting firms, and agencies. (Conductor, 2022)
- For organic marketing, the top five metrics tracked to indicate success are: website traffic, website engagement, search rankings, revenue, and conversions. (Conductor, 2022)
- 79% of marketing leaders are the primary decision makers on SEO technology. Half of digital marketing leaders (46%) tend to form a group with digital marketing implementers to make purchasing decisions. (Conductor, 2022)
Social media statistics
- 74% of marketers actively invest in social media marketing. (HubSpot, 2020)
- Facebook, Instagram, and Twitter are the most popular social media platforms among marketers. (HubSpot, 2020)
- 47% of marketers say their social media budgets will increase in 2021. (Criteo, 2021)
- The most common publishing cadence on social media is three to four times per week. (HubSpot, 2020)
- Marketers share that they record the biggest social media engagement by using photo and video content. (HubSpot, 2020)
- Social listening is marketers’ number one activity on social media. (HubSpot, 2020)
Video marketing statistics
- 34% of marketers will increase their budget for paid video in 2021. (Criteo, 2021)
- 50% of marketers share that they’ve spent more than 20% of the digital marketing budget on paid video in 2020. (Criteo, 2021)
- 60% of the world’s mobile phone video viewership will take place in Asia by 2023 versus 8% in North America. (Kantar, 2020)
- 85% of businesses use video as a marketing tool. (Wyzowl, 2020)
- 87% of video marketers say video has increased traffic to their website, while 80% say it has directly helped increase sales, and 83% say video has helped them generate leads. (Wyzowl, 2020)
- 43% of marketers say video has reduced the number of support calls they’ve received. (Wyzowl, 2020)
- 66% of consumers prefer to learn about a product or service by watching a short video. (Wyzowl, 2020)
- 96% of people have watched an explainer video to learn more about a product or service. Additionally, seven out of ten consumers say they’ve been convinced to make a purchase or download after watching a video. (Wyzowl, 2020)
- YouTube remains the most widely used video platform among marketers. (Wyzowl, 2020)
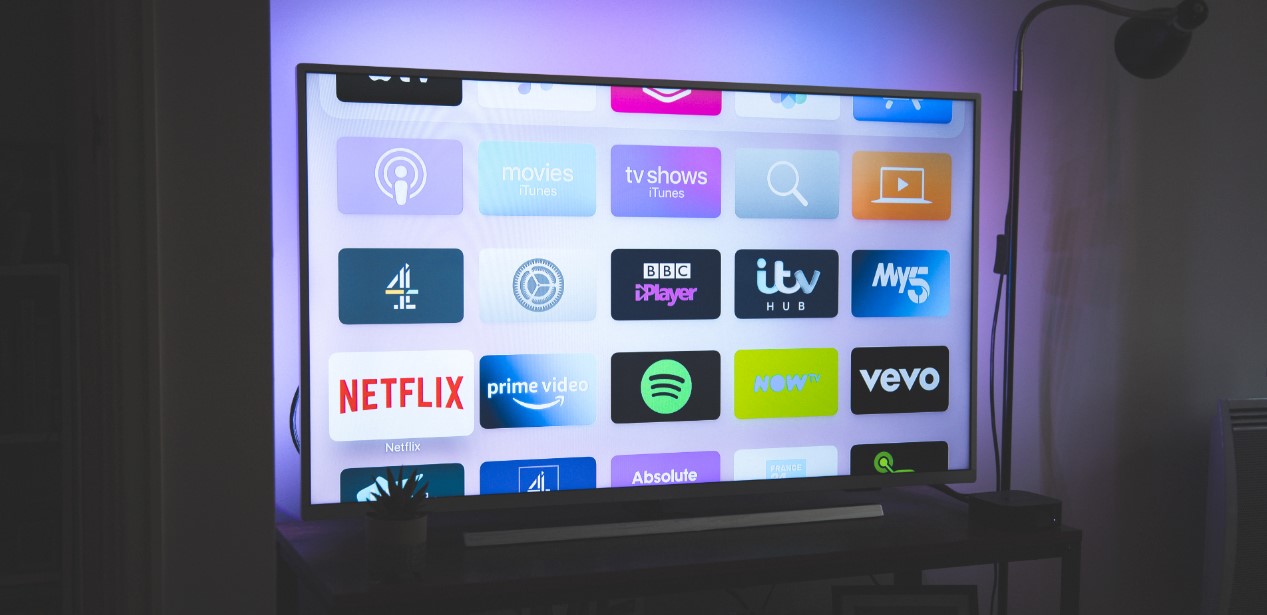
OTT marketing statistics (TV streaming)
- 57% of viewers in Southeast Asia are watching more OTT content during the pandemic. 72% plan to maintain or increase their OTT viewing in the future. (Kantar, 2020)
- 18% of OTT viewers in Southeast Asia spend more than four hours watching per day. (Kantar, 2020)
- On average, viewers in Southeast Asia spend 2.5 hours per day, for 17 days, watching OTT content. Most of them tune in between 8pm and 11pm. (Kantar, 2020)
- 89% of OTT viewers in Southeast Asia are open to watching ads in exchange for free content. (Kantar, 2020)
- Smartphones are the number one device used by OTT viewers in Southeast Asia. (Kantar, 2020)
PR and journalism statistics
- Staffing and resources (22%) is the biggest challenge faced by journalists. It is more of a concern than the threat of influencers bypassing the media (18%), as well as the fight against fake news (16%). (Cision, 2020)
- 36% of journalists plan their stories daily or more frequently. 42% plan their stories a week to a month in advance. (Cision, 2020)
- Journalists share that press releases are still the most preferred brand source when writing a story. (Cision, 2020)
- Journalists deem interviews (face-to-face or via call) to be the most trustworthy non-brand story source. (Cision, 2020)
- Most journalists prefer to receive story pitches on Monday. (Cision, 2020)
- One in four journalists receive more than 50 story pitches in a week. (Cision, 2020)
- 99% of journalists say that most story pitches they receive are not relevant to their target audience. (Cision, 2020)
- In 2021, the top stories that journalists are looking for are new angles related to Covid-19 (45.5%), how companies and communities are helping others (36.5%), and stories on furthering diversity, inclusion, and equality (33.3%). (Cision, 2021)
- Journalists will pay more attention to story pitches that are related to a particular trending topic or offer surprising data. (Muck Rack, 2021)
- 91% of journalists prefer to receive pitches under 200 words in length. (Muck Rack, 2021)
- 94% of journalists prefer to receive pitches via one-on-one email. On the other hand, 66% dislike receiving pitches via phone. (Muck Rack, 2021)
- Most journalists prefer to have at least two days of breathing room before PR pros follow up on their pitch. (Cision, 2021)
- Almost 50% of journalists cover five or more beats. (Cision, 2021)
- Sending spam emails is the biggest reason journalists put people on the blocklist. (Cision, 2021)

Loyalty marketing statistics
- 66.7% of APAC marketers believe that loyalty marketing is important. (Antavo, 2022)
- APAC organizations that offer loyalty programs typically spend 23.3% of their marketing budget on loyalty program management and CRM. (Antavo, 2022)
- Only half (57.6%) of APAC marketers track their loyalty marketing ROI. (Antavo, 2022)
- 30.3% of APAC marketers offer emotional loyalty incentives as opposed to transactional ones. (Antavo, 2022)
- 57.6% of APAC marketers want to offer more personalized rewards in the next three years. (Antavo, 2022)
- The APAC loyalty management market was worth US$945.9 million in 2020 and is projected to grow to US$3,641.77 million by 2026. (Mordor Intelligence, 2021)
- 86% to 92% of APAC customers prefer to shop at places offering loyalty programs. (Mordor Intelligence, 2021)
- 35% of APAC consumers say that reward points and cash back incentives play a significant role in influencing their decisions when choosing a credit card.
Digital advertising statistics
- Three in ten advertisers cite the importance of not showing ads next to hateful or fake content. (Criteo, 2021)
- B2B marketers’ top three digital advertising channels in 2020 were social media advertising, search engine marketing (SEM), and event sponsorships. (CMI, 2020)
- The number one paid social media platform among B2B marketers in 2020 was LinkedIn. (CMI, 2020)
Statistics on thought leadership in marketing
- 54% of B2B decision makers spend at least one hour reading thought leadership content per week. (Edelman, 2021)
- 51% of C-level executives spend more time consuming thought leadership content than before the pandemic. (Edelman, 2021)
- 4 in 10 B2B decision makers feel the market is oversaturated with thought leadership content. (Edelman, 2021)
- 89% of B2B decision makers believe that thought leadership content can help change their perception of an organization. (Edelman, 2019)
- 59% of B2B decision makers agree that thought leadership content is a better way to assess a company’s capabilities than its marketing materials. (Edelman, 2019)
- 49% of B2B decision makers agree that thought leadership content can effectively influence their purchasing decisions. (Edelman, 2019)
- 42% of B2B decision makers are willing to pay a premium to companies that produce thought leadership content as compared to those who do not. (Edelman, 2019)
- 47% of B2B decision makers say that thought leadership content led them to discover and purchase from companies that are not widely considered industry leaders. (Edelman, 2021)
- 50% of B2B buyers believe that thought leadership is important for attracting the best talent. (Edelman, 2021)
- Only 15% of B2B decision makers say that most of the thought leadership content they regularly read is very good. (Edelman, 2019)
- 29% of B2B decision makers gain valuable insights from more than half of the thought leadership content they read. (Edelman, 2019)
- 38% of decision makers say that their respect and admiration toward a company sometimes decrease after reading bad thought leadership content. (Edelman, 2019)
- 74% of thought leadership content creators cannot link their performance with the company’s revenue. (Edelman, 2019)
- 87% of B2B buyers say that thought leadership content can be both intellectually rigorous and fun to consume at the same time. (Edelman, 2021)
- B2B buyers share their preferred thought leadership content attributes: a more human, less formal voice (64%), offers provocative ideas to challenge their assumptions (81%), features deep subject matters delving into specialized topics -- as opposed to senior executives speaking on high-level business issues (77%), includes third party data and insights from trusted sources (80%), and prominently features the point of view of an identifiable author (67%). (Edelman, 2021)
- Three main reasons decision makers consume thought leadership content: keeping up-to-date with the latest thinking, gaining insights into key business trends, and discovering new products to support the organization. (Edelman, 2021)

User experience statistics
- One in two US consumers believe that website design is important to a company’s overall branding. (Top Design Firms, 2021)
- One in three US consumers put “engaging user experience” as a top priority for website designs. (Top Design Firms, 2021)
- The top three website visual elements that US consumers pay attention to are photos and images (40%), color (39%), and videos (21%). (Top Design Firms, 2021)
- US consumers prefer it if a business uses the color blue (46%) and green (30%) in its website. (Top Design Firms, 2021)
- 42% of people in the US would leave a website because of poor functionalities. (Top Design Firms, 2021)

Digital messaging (email, push notifications, SMS) statistics
- B2C marketers send between 80 to 120 million digital messages per year to around 5 to 40 million people. (MessageGears, 2021)
- Most B2C marketers believe that at least 40% of their company sales come from digital messaging efforts. (MessageGears, 2021)
- The majority of B2C marketers allocate at least 25% of their spend to digital messaging. (MessageGears, 2021)
- Almost half of B2C marketers spent between US$1 million to US$5 million for messaging (which includes both tools and people) in 2020. (MessageGears, 2021)

Martech statistics
- One in three B2C marketers believes that best-in-breed apps can be a better investment than an all-in-one martech stack. (MessageGears, 2021)
- 60% of US marketers are using more than 20 marketing tools. (AirTable, 2021)
- US marketers say that around 34% of data and information is duplicated across different sources like documents and apps. More than half of US marketers are still synchronizing data somewhat or completely manually. (AirTable, 2021)
- 68% of startups use martech tools. (GetApp, 2021)
- Marketers who don’t have a plan for their martech tools are four times more likely to be disappointed with their tools and results. (GetApp, 2021)
- Most startups are using free martech software (56%). Of those who spend money, most are spending between US$1,001 and US$10,000 per month. (GetApp, 2021)
- The biggest benefits of martech tools are improved customer engagement (45%), more precise audience targeting (37%), and more effective marketing campaigns (36%). (GetApp, 2021)
- The biggest challenges of using martech tools are too many overlapping features (35%), too many unused features (30%), and the overall complexity of tools (30%). (GetApp, 2021)
- The most effective martech tools among startups are A/B testing (62%), web analytics (58%), CRM software (56%), multi-touch attribution (57%), social media marketing (56%), and content marketing (54%). (GetApp, 2021)
Sources
- Antavo, 2022 - APAC Customer Loyalty Report 2022
- Technavio, 2022 - Content Marketing Market by Objective, Platform, End-user, and Geography - Forecast and Analysis 2021-2025
- Conductor, 2022 - The State of Organic Marketing 2022
- Casted, 2022 - The State of the Content Marketer Report
- Mordor Intelligence, 2021 - APAC Loyalty Management Market - Growth, Trends, COVID-19 Impact, and Forecasts (2021 - 2026)
- Top Design Firms, 2021 - Website Redesign Checklist
- MessageGears, 2021 - 2021 B2C Digital Marketing Trends
- AirTable, 2021 - Airtable Marketing Trends Report
- GetApp, 2021 - How Effective are Startups’ Marketing Stack?
- Cision, 2021 - Cision’s 2021 State of the Media
- Muck Rack, 2021 - New Muck Rack survey: The State of Journalism 2021
- Edelman, 2021 - 2021 B2B Thought Leadership Impact Study
- Criteo, 2021 – State of Digital Advertising 2021
- SEMrush, 2021 – The State of Content Marketing 2020 Global Report
- CMI, 2020 – Content Marketing Institute’s 11th Annual B2B Content Marketing Report
- Animalz, 2020 – The Animalz Content Marketing Benchmark Report 2020
- Borrell, 2020 – Sizing The Content Marketing Opportunity
- Cision, 2020 – 2020 State of the Media
- Kantar, 2020 – The Future of TV
- HubSpot, 2020 – Not Another State of Marketing Report
- Wyzowl, 2020 – The State of Video Marketing 2020
- Edelman, 2019 – 2020 B2B Thought Leadership Impact Study
Save time and money when producing high-quality press releases and thought leadership articles with ContentGrow. Sign up to get your campaign started or book a quick call with our team to learn more.


