Influencer marketing budget calculator: how to allocate spend in 2026
How to build an influencer marketing budget that actually compounds

Most influencer marketing budgets are built the wrong way. A number gets anchored to last year's spend, adjusted upward by whatever percentage someone could defend in a planning meeting, then carved into platform-by-platform lines without a coherent framework. The result: brands either underspend in ways that guarantee weak results, or spread budget so thinly across creators and channels that nothing compounds.
The good news is that 2026 has unusually clear budget benchmarks to work from. According to Aspire's 2026 State of Influencer Marketing report, 74% of marketers plan to increase their influencer budgets this year, and brands now allocate an average of 23% of total marketing budgets to creator partnerships. That is a meaningful signal about where the category sits in the priority stack.
This guide walks through how to set your total budget, allocate it across creator tiers and platforms, account for the hidden costs most teams miss, and defend the number to your CFO. The framework works whether you are building from scratch or stress-testing an existing allocation.
Table of contents
Jump to each section:
- What the 2026 budget data actually tells us
- Setting your total influencer marketing budget
- How to allocate by creator tier
- Platform allocation: matching spend to your audience
- The B2B budget framework
- Budget lines most brands forget
- Turning your budget into a case for the C-suite
What the 2026 budget data actually tells us
The aggregate budget story in 2026 is bullish, but the distribution reveals nuance that most brand marketers miss.
Brands allocated an average of 23% of their total marketing budgets to creator partnerships last year, and with 74% of marketers now planning to increase those budgets, that share is expected to climb further. Most programs still live below the US$250,000 annual mark, representing 61% of respondents in Aspire's survey — and Aspire reads that not as a sign of weak confidence but as evidence that brands are deploying influencer marketing within measured, accountable envelopes.
The Influencer Marketing Hub Benchmark Report 2026 shows even sharper intent: 87.49% of surveyed brands expect their influencer budgets to increase, with 72.22% planning hikes of 50% or more. These are planned investment figures, not confirmed performance, but the direction is unambiguous.
On the return side, Aspire's 2025 State of Influencer Marketing report found that 91% of brands using influencer marketing say creator content drives more ROI than traditional digital ads. That is a sentiment figure, not a cash-on-cash return, but the directional signal is consistent with what the budget data shows: brands are increasing influencer spend because it is outperforming the alternatives, not because they are spending on faith. For B2B brands with 60- to 90-day sales cycles, the exact return will look different from a DTC brand attributing influencer-driven purchases within 48 hours, but the efficiency advantage holds across both contexts.
The practical takeaway from the data: budgets are going up, most programs operate at under US$250,000 annually, and the brands increasing fastest are treating influencer marketing as an always-on channel rather than a campaign line item.
Setting your total influencer marketing budget
The most defensible starting point is to anchor your influencer budget as a percentage of your total marketing spend, then adjust for your industry vertical and program maturity.
Most brands allocate 10% to 20% of their total marketing budget to influencer marketing, with heavier spenders reaching 26%. E-commerce and beauty brands typically spend more (20% to 30%), while B2B companies tend to spend less (5% to 10%).
Three scenarios that cover most readers:
If your annual marketing budget is US$100,000, a 10% to 15% influencer allocation (US$10,000 to US$15,000) is a sensible starting point for a test-and-learn year. You can activate 20 to 30 nano and micro creators, build attribution infrastructure, and generate first-party data to justify a larger allocation the following cycle.
If your annual marketing budget is US$500,000, an 18% to 23% allocation (US$90,000 to US$115,000) moves you into program-level investment, with enough budget to work across multiple creator tiers and platforms while funding the tooling and management layer the program needs to compound.
If your annual marketing budget is US$1 million or more, a 20% to 25% allocation (US$200,000 to US$250,000) puts you in the majority tier per Aspire's data. At this scale, you can run an always-on creator program, layer in paid amplification, and integrate with your CRM for full influencer marketing ROI framework coverage.
The 23% average is a benchmark, not a mandate. The right percentage is the one your organization can measure, optimize, and defend in a board review.
How to allocate by creator tier
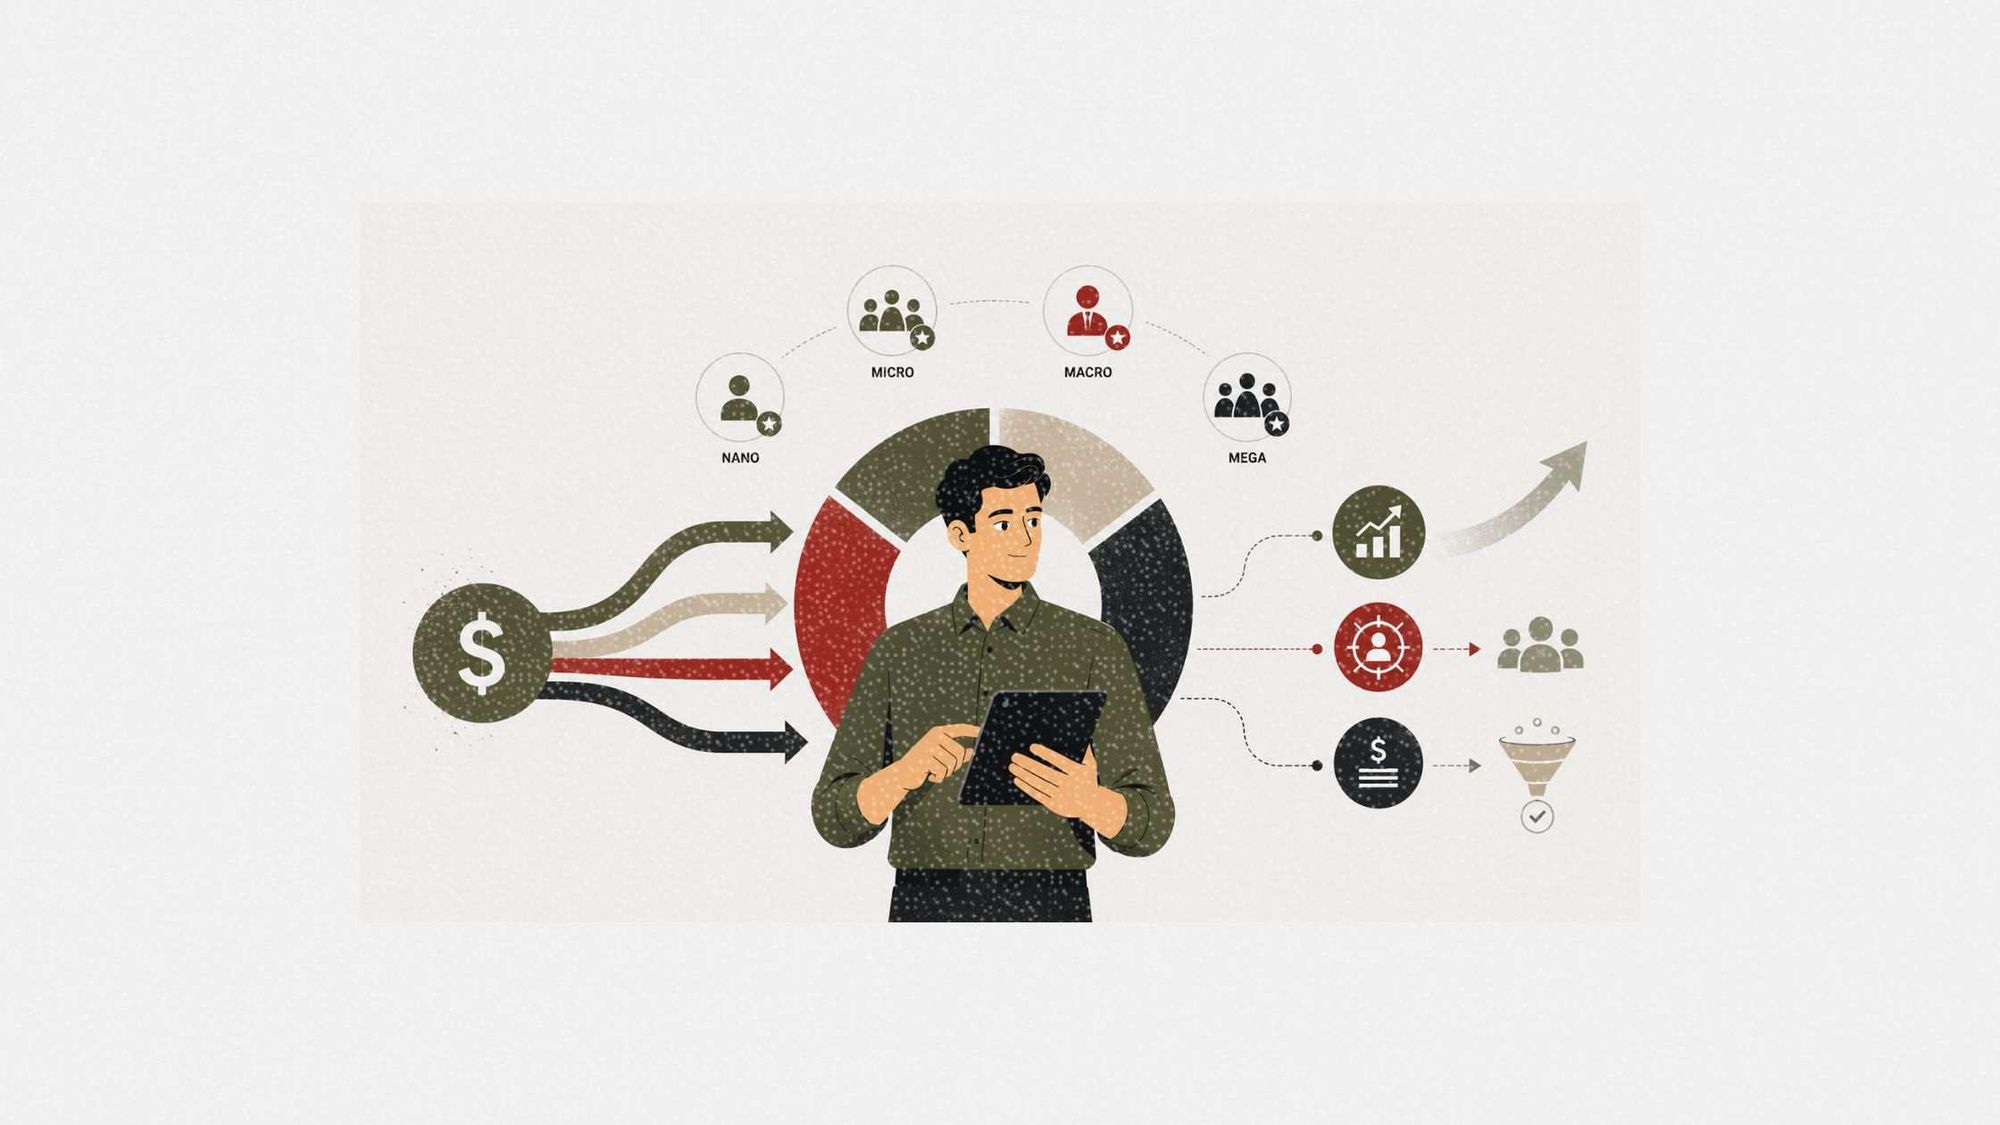
The tier allocation question has a clear 2026 answer: weight toward nano and micro creators as your performance engine, with macro and mega creators reserved for specific awareness objectives.
According to Digital Web Solutions, 40% of all influencer marketing budgets are now dedicated specifically to the micro-influencer tier, signaling a strategic prioritization of targeted engagement over broad celebrity reach. The logic holds: micro-influencers (10,000 to 100,000 followers) generate lower CPMs on average and reach more precisely defined audiences than larger tiers.
A practical tier allocation framework for 2026:
50% to 60% toward nano and micro creators (under 100,000 followers). This is your performance and always-on layer. At scale, activating 20 to 50 creators in this tier generates the content volume needed to support both organic and paid distribution.
20% to 30% toward mid-tier and macro creators (100,000 to 1 million followers). Reserve this for campaign launches, new market entry, or moments when top-of-funnel reach justifies the premium. One macro creator can move awareness metrics that 40 nano creators cannot shift as quickly.
10% to 20% held for testing: emerging creators, new content formats, untested platforms, or affiliate pilots. The 70/20/10 rule is a useful internal framework: 70% on proven tactics you know work for your brand, 20% on scaling what is promising, and 10% on pure experiments. It has the additional advantage of being explainable to finance teams.
For rate benchmarks by tier before finalizing these allocations, see the influencer marketing rate card.
Platform allocation: matching spend to your audience
Platform allocation should follow your audience, not the trend headlines. That said, the 2026 platform mix has real data behind it.
Instagram remains the dominant platform overall, with over 80% of marketers using it for influencer campaigns. TikTok is closing the gap fast, especially with younger audiences. YouTube holds disproportionate ROI value per content piece for B2B SaaS, where long-form review and demo content drives bottom-funnel action.
For most multi-platform programs, a practical starting allocation is: 40% to 50% toward your primary platform, 25% to 35% toward a secondary platform, and 15% to 25% reserved for LinkedIn (B2B), YouTube (long-form trust building), or emerging channels depending on your ICP.
The trap is spreading the platform too thin. US$20,000 divided across five platforms at US$4,000 each guarantees mediocre results everywhere. US$20,000 concentrated on one or two platforms generates the creator activation density needed to learn what works and optimize the next cycle.
If APAC markets are part of your footprint, build in a separate rate assumption for each country. Rates differ substantially from Western averages, and from each other: AnyMind Group's State of Influence in APAC 2026 report, drawing on nearly 7,000 campaigns across ten markets, shows platform mix, creator tier performance, and campaign economics varying significantly between Indonesia, Thailand, Vietnam, and Singapore.
The B2B budget framework
B2B influencer budgets operate differently, and plugging a B2B program into a DTC allocation template is one of the most common and expensive mistakes in the category.
The differences are structural. B2B buyers make decisions over weeks or months, not minutes. The creators who move B2B pipeline are often operators, practitioners, or subject-matter experts with audiences of a few thousand. The content formats that work, including LinkedIn carousels, long-form YouTube reviews, and newsletter sponsorships, carry different production and distribution costs than short-form video.
Dinda Anandita, Account Director at Content Collision, sees this misalignment play out repeatedly in how brands approach their B2B budgets: "Most B2B brands underinvest in the influencer relationship itself. They allocate for content fees but forget the brief development, the review cycles, the amplification budget, and the time it takes to co-create something a B2B buyer actually trusts. What looks like a US$15,000 influencer line item in a spreadsheet is really a US$25,000 program once you run it properly."
For B2B brands, a workable starting framework looks like this:
60% to 70% of creator fees toward LinkedIn-native creators, newsletter authors, or podcast hosts in your specific vertical. These creators have smaller audiences but higher ICP concentration, making their CPM-to-pipeline conversion far more efficient than larger-reach generalist accounts.
20% to 30% for co-created long-form content: webinars, podcast sponsorships, or YouTube explainers. These formats align with B2B sales cycles by delivering depth rather than reach, and they create reusable assets the sales team can circulate post-publish.
10% to test formats such as employee advocacy amplification or whitelisted LinkedIn posts, where the influencer's organic content acts as a signal layer that triggers paid distribution only on posts already showing early traction.
Budget lines most brands forget
The creator fee is the visible number. What follows are the budget items that regularly catch teams short at mid-campaign.
Content usage rights and whitelisting fees add 15% to 30% on top of the base creator rate for most mid-tier and above partnerships. With 77% of brands now repurposing creator content in paid ads, 67% of brands are baking content usage rights into the creator's initial contract or rate rather than renegotiating post-launch. If you plan to amplify influencer content through paid channels, price the license into the original deal.
Platform amplification budget is separate from creator fees. The paid distribution layer that turns an organically successful post into a broader reach moment requires its own line, typically 20% to 40% of creator fee spend for programs that integrate influencer content into paid social.
Tooling and management costs are often invisible until you are managing 30 or more active creators. Discovery and analytics platforms run from US$100 to US$1,000 or more per month depending on scale. Attribution infrastructure, UTM setup, CRM integration, and reporting dashboards add further time and cost that most initial budget drafts omit.
Legal and compliance costs, including contract review and FTC disclosure workflow management, are low per creator but accumulate across a full program roster. Given that the FTC's 2023 Endorsement Guides remain in active enforcement, this is not an optional line.
A rule of thumb: your true program cost is approximately 1.4 to 1.6 times your creator fee budget once you account for these additional layers.
Turning your budget into a case for the C-suite
The most effective move in the budget approval process is connecting influencer spend to a metric your CFO already tracks rather than introducing a new one.
A useful floor-case assumption when modeling the business case: if your proposed US$50,000 program returns even US$2 to US$3 per dollar spent, consistent with mid-range program performance documented across multiple industry studies, you are looking at US$100,000 to US$150,000 in attributable value. That is the number that opens the conversation.
For B2B programs, the ROI argument lands better in pipeline language. What is the average contract value of a qualified lead in your CRM? If the answer is US$2,500, and your influencer program generates 40 MQLs over a quarter, that is US$100,000 in pipeline from a US$30,000 program. That framing connects influencer spend directly to a number finance already monitors.
Show your measurement methodology before you show results. Executives who push back on influencer ROI are usually questioning the measurement, not the channel. A clean UTM structure, a defined attribution window, and a pre-agreed definition of what counts as a conversion removes that objection before it is raised.
The most durable budget case frames influencer marketing as infrastructure with compounding returns rather than a campaign with one-time value. Programs that run for 12 months consistently outperform those that run for 12 weeks. The pitch that wins approval anchors on the long arc.